The GAAP is only part of the problem:
Writer Gertrude Stein once said, "A rose is a rose is a rose," but the same cannot be said about earnings per share (EPS).
While the math may be simple, there are many varieties of EPS being used these days and investors must understand what each one represents, if they're to make informed investment decisions. For example, the EPS announced by a company may differ significantly from what is reported in the financial statements and in the headlines. As a result, a stock may appear over or under-valued depending on the EPS being used. This article will define some of the varieties of EPS and discuss their pros and cons.
Tutorial: How to Analyze EarningsBy definition, EPS is net income divided by the number of shares outstanding, however, both the numerator and denominator can change depending on how you define "earnings" and "shares outstanding." There are numerous ways to define earnings, so let's start with shares outstanding.
Shares Outstanding
Shares outstanding can be classified as either primary, or basic, (primary EPS) or fully diluted (diluted EPS). Primary EPS is calculated using the number of shares that have been issued and held by investors. These are the shares that are currently in the market and can be traded.
Diluted EPS entails a complex calculation that determines how many shares would be outstanding if all exercisable warrants, options, etc. were converted into shares at a point in time, generally the end of a quarter. Diluted EPS is preferred, because it is a more conservative number that calculates EPS, as if all possible shares were issued and outstanding. The number of diluted shares can change as share prices fluctuate (as options fall into/out of the money), but generally the Street assumes the number is fixed as stated in the 10-Q or 10-K.
Companies report both primary and diluted EPS and the focus is generally on diluted EPS, but investors should not assume this is always the case. Sometimes, diluted and primary EPS are the same, because the company does not have any "in-the-money" options, warrants or convertible bonds outstanding. Companies can discuss either, so investors need to be sure which is being used. (For more insight, see Getting The Real Earnings.)
Earnings As a general rule, EPS can be whatever the company wants it to be, depending on assumptions and accounting policies. Corporate spin doctors focus media attention on the number the company wants in the news, which may or may not be the EPS reported in documents filed with the Securities & Exchange Commission (SEC). Based on a set of assumptions, a company can report a high EPS, which reduces the P/E multipleand makes the stock look undervalued. The EPS reported in the 10-Q, however, can result in a much lower EPS and an overvalued stock on a P/E basis. This is why it is critical for investors to read carefully and know what type of earnings is being used in the EPS calculation.
There are five types of EPS to be defined in the context of the type of "earnings" being used:
Reported EPS (or GAAP EPS) We define reported EPS as the number derived from generally accepted accounting principles (GAAP), which are reported in SEC filings. The company derives these earnings according to the accounting guidelines used. A company's reported earnings can be distorted by GAAP. For example, a one-time gain from the sale of machinery or a subsidiary could be considered as operating income under GAAP and cause EPS to spike. Also, a company could classify a large lump of normal operating expenses as an "unusual charge," which can boost EPS because the "unusual charge" is excluded from calculations. Investors need to read the footnotes in order to decide what factors should be included in "normal" earnings and make adjustments in their own calculations. (To learn more about what can be found in the footnotes, read Footnotes: Start Reading The Fine Print.
Ongoing EPS Ongoing EPS is calculated based upon normalized, or ongoing, net income and excludes anything that is an unusual one-time event. The goal is to find the stream of earnings from core operations, which can be used to forecast future EPS. This can mean excluding a large one-time gain from the sale of equipment, as well as an unusual expense. Attempts to determine an EPS using this methodology is also called "pro forma" EPS.
Pro Forma EPS The words "pro forma" indicate that assumptions were used to derive whatever number is being discussed. Different from reported EPS, pro forma EPS generally excludes some expenses or income that were used in calculating reported earnings. For example, if a company sells a large division, it could, in reporting historical results, exclude the expenses and revenues associated with that unit. This allows for more of an "apples-to-apples" comparison.
Another example of pro forma is a company choosing to exclude some expenses, because management feels that the expenses are non-recurring and distort the company's "true" earnings. Non-recurring expenses, however, seem to appear with increasing regularity these days. This raises questions as to whether management knows what it's doing, or is trying to build a "rainy day fund" to smooth EPS.
Headline EPS The headline EPS is the EPS number that is highlighted in the company's press release and picked up in the media. Sometimes it is the pro forma number, but it could also be an EPS number that has been calculated by the analyst or pundit that is discussing the company. Generally, sound bites do not provide enough information to determine which EPS number is being used. (For more on how companies can skew their results, read 5 Tricks Companies Use During Earnings Season.)
Cash EPS Cash EPS is operating cash flow (not EBITDA) divided by diluted shares outstanding. Generally, cash EPS is more important than other EPS numbers, because it is a "purer" number. Cash EPS is better because operating cash flow cannot be manipulated as easily as net income and represents real cash earned, calculated by including changes in key asset categories, such as receivables and inventories. For example, a company with reported EPS of 50 cents and cash EPS of $1 is preferable to a firm with reported EPS of $1 and cash EPS of 50 cents. Although there are many factors to consider in evaluating these two hypothetical stocks, the company with cash is generally in better financial shape.
Other EPS numbers have overshadowed cash EPS, but we expect it to get more attention because of the new GAAP rule (FAS 142), which allows companies to stop amortizing goodwill. Companies may start talking about "cash EPS" in order to differentiate between pre-FAS 142 and post-FAS 142 results, however, this version of "cash EPS" is more like EBITDA per share and does not factor in changes in receivables and inventory. Consequently, it may not be as good as operating-cash-flow EPS, but is better in certain cases than other forms of EPS.
The Bottom Line
There are many types of EPS being used and investors need to know what the EPS numbers they see represent and determine whether they are a good representation of a company's earnings. A stock may look like a great value because it has a low P/E, but that ratio may be based on assumptions which, upon further research, you might not agree with.
Start Using the Best Trading Tools Today Today’s markets are filled with opportunities, but active traders need to move fast. E*TRADE offers intuitive technology, real-time analytical tools, and best execution to give you an edge. Click here to discover all that E*TRADE can offer today!

Read more: http://www.investopedia.com/articles/analyst/091901.asp#ixzz3hKBYFzFj Follow us: @Investopedia on Twitterhttp://www.investopedia.com/articles/analyst/091901.asp
The P/E ratio being reported is not the fundamental PE Ratio, but instead a trailing ratio.
In the U.S. the PE ratios for the big techies is either the trailing or forward ratio, not the fundamentals.
So Google's listed PE ratio is 31.80,
It's last trade on Friday was 672.93
it's a trailing ratio...
Google Last Trade 6/17/2015 = 672.93
6/30/2015 3/30/2015 12/30/2015 9/30/2015
diluted weighted shares 685.49 685.49 688.49 688.22
diluted eps 4.97 5.13 5.5 4.36
Sum of diluted eps = 19.96
STANDARD P/E 672.93/4.97 = 135.3983903
TRAILING P/E RATIO 672.93 /19.96 = 33.71392786
https://www.google.com/finance?q=NASDAQ%3AGOOG...
Where was the disclaimer that US PE Ratios are trailing? It's an undisclosed "industry trend"... if the retail investor knows. PFfft.
http://seekingalpha.com/article/1043751-the-not-so-standard-trailing-p-e-ratio
So Google's listed PE ratio is 31.80,
It's last trade on Friday was 672.93
it's a trailing ratio...
Google Last Trade 6/17/2015 = 672.93
6/30/2015 3/30/2015 12/30/2015 9/30/2015
diluted weighted shares 685.49 685.49 688.49 688.22
diluted eps 4.97 5.13 5.5 4.36
Sum of diluted eps = 19.96
STANDARD P/E 672.93/4.97 = 135.3983903
TRAILING P/E RATIO 672.93 /19.96 = 33.71392786
https://www.google.com/finance?q=NASDAQ%3AGOOG...
Where was the disclaimer that US PE Ratios are trailing? It's an undisclosed "industry trend"... if the retail investor knows. PFfft.
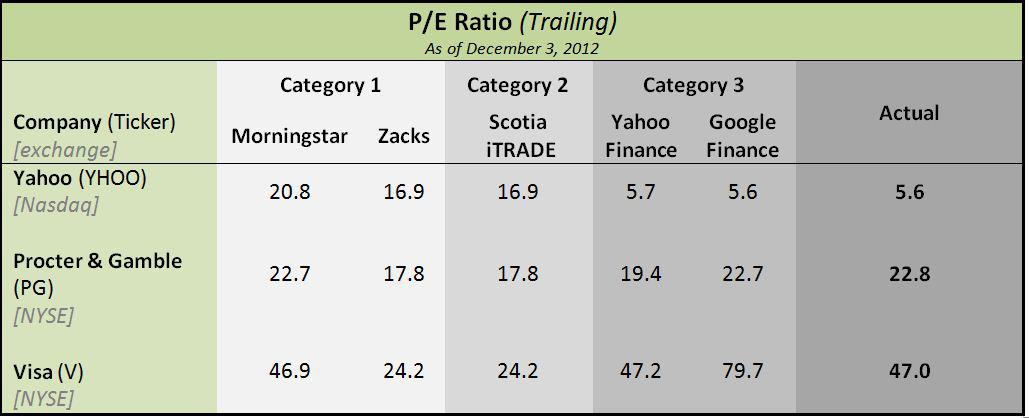
"The trailing Price to Earnings (P/E) ratio is one of the most well-known and widely used ratios for comparing the relative value of stocks. All investors have heard of it, and many are aware of its definition - the current price of a stock divided by a company's earnings per share over the last 12 months. While the effectiveness of this number as a medium to determine stock value has been, and continues to be, debated, many investors will examine the ratio prior to investing in a stock. Retail investors, in particular, tend to place a strong emphasis on the P/E ratio and use it as one of the factors in determining whether a stock is undervalued or overvalued. A quick examination of a company's financial statements, stock price and basic math will yield the number; however, most investors turn to the internet, and the vast selection of financial resources available, to obtain the value. The ratio can be found on almost every financial website and one would expect for it to be consistent across them. An acceptable expectation, but one I found not to be realistic.For the purposes of this article, let's break down the most common financial internet resources into 3 main categories:
- Category 1 - Investment research websites (eg. Morningstar, Zacks)
- Category 2 - Stock brokerage websites (eg. Scotia iTRADE, E-Trade)
I visited a sample of websites in each of these categories and gathered the trailing P/E ratio for a number of stocks in different industries. They can be found in the table below. I also browsed through the company's financial statements and calculated the ratio myself. I was shocked to see that a ratio, which is based on standard math, varied so largely from website to website. A variance most investors would never note as, unlike analyst opinion, financial ratios should be standard - there would be no reason to examine other resources for a second opinion.(click to enlarge)
- Category 3 - Financial news websites (eg. Yahoo Finance, Google Finance)
Investors relying on these websites for their financial information or for screening potential investments, may end up missing investment opportunities, or worse, make investment decisions based on erroneous information. Consider an investor who follows a strategy investing in low P/E Stocks. If the investor obtains information from websites in Category 1 and 2, the investor would completely discount Yahoo (NASDAQ:YHOO) as a potential investment. Another investor following the exact same strategy and using websites in Category 3, would be delighted to discover Yahoo, a stock with such a low P/E ratio, and would consider investigating it further.
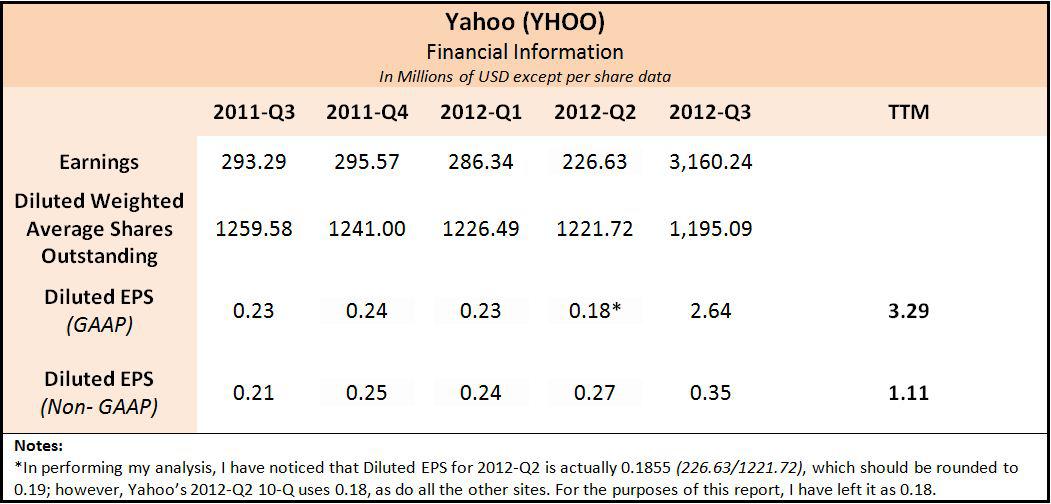
To determine the source of these inconsistencies, we can use the financial statements of one of the companies - Yahoo.
(click to enlarge)The trailing P/E ratio can be calculated by dividing the stock price by the trailing twelve months [TTM] diluted earnings per share.
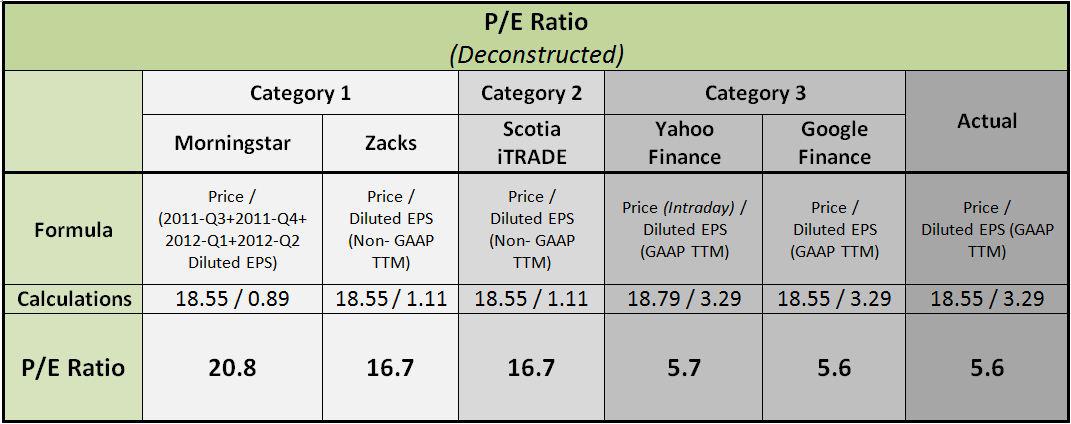
Using Yahoo's closing price on December 3, 2012, the trailing P/E ratio would equal 5.6 (18.55/3.29); a number very different from the websites in category 1 and 2, but close to the ones in category 3. To determine how each of the websites is arriving at its version of the P/E Ratio, I attempted to deconstruct the ratio and examine the possibility of inputs. The results can be found in the table below.
(click to enlarge)I discovered that each website, with the exception of Google Finance, was using different inputs for determining a ratio, which should be based on standard inputs and standard math. Morningstar appeared to be overlooking the EPS from the most recent quarter, while Zacks & Scotia iTRADE were using Non-GAAP numbers for their EPS. The latter is particularly concerning in that I could find no disclosure on Zacks or Scotia iTRADE to inform a potential investor of this practice.
I found Google Finance to be the only site using the correct formula; however that still didn't guarantee a correct trailing P/E. As shown in the graphic above, with my example of Visa (NYSE:V), Google Finance calculated a trailing P/E of 79.7, while in reality the trailing P/E was 47. The discrepancy could be traced to Google Finance using a Diluted EPS (GAAP TTM) of 2.22, when Visa's 10-K has 3.16.
Ultimately, it is always up to the investor to perform his or her own due diligence. The vast availability of financial resources on the internet can offer investors great tools; however, one should be prudent in not relying on the numbers completely for making investment decisions. There is no substitute for turning to a company's official Quarterly (10-Q) and Annual (10-K) reports and calculating the numbers yourself. Many companies make their reports available on their own websites and the SEC offers an excellent search engine to search for a company's filings at http://www.sec.gov."
http://seekingalpha.com/article/1043751-the-not-so-standard-trailing-p-e-ratio
No comments:
Post a Comment